
Centralized syslog is one of those problems everyone has solved at least once, and nobody enjoys owning. You stand up a collector, point your firewalls and switches and servers at it, and then you own a fleet of log servers forever: patching them, scaling them, securing them, and explaining to an auditor why last March's logs are or aren't still there. The collector is never the interesting part of the system, but it is always on the critical path and always on the pager.
We built a reference implementation on Proxylity UDP Gateway — our managed UDP ingestion service — that removes the collector entirely. There is no server to patch and, notably, no Lambda function to patch either. The entire multi-site pipeline is configuration: two JSON files and one AWS CDK stack. And despite running no code, it does more than most hand-built collectors ever do: immutable WORM evidence, live alarms per site, columnar analytics over the full retention period, separation of duties for auditors and operators, optional SIEM forwarding, and cross-region disaster recovery.
We'll walk through how that's possible, what our gateway contributes that makes it possible, and why — if you're responsible for the budget or the audit — we think it's worth a serious look. We're biased, of course; this is enabled by our product. But the architecture is open in our syslog repository, so you can check our claims against the code.
In this article
The collector tax
A traditional syslog deployment hides its real cost in operations. UDP syslog itself is simple, but the infrastructure around it accumulates:
- Servers that must stay up. rsyslog or syslog-ng on an instance (or 3+1, for HA), with an OS to patch, a disk to monitor, and a failover story to test.
- Scaling that's your problem. A burst of traffic — a misconfigured device, a security event, a chatty firmware update — is a capacity question you have to answer in advance.
- Transport you have to secure. Syslog over the public internet is plaintext. Getting it encrypted and authenticated across sites usually means a VPN concentrator, which is one more box.
- Retention you have to prove. Auditors don't want "we think it's on that volume." They want immutability, access control, and a defensible retention policy.
None of this is hard in isolation. The tax is that it's permanent and it's yours. Every one of those pieces is a thing that can page you, drift out of patch compliance, or quietly fill a disk at 2am.
And lately the transport box — the VPN concentrator or firewall that gets your logs across sites — has become something worse than a maintenance chore. Internet-facing edge appliances are where attackers are spending their time right now. Through late 2025 and 2026, a steady run of actively exploited VPN and firewall flaws has landed in CISA's Known Exploited Vulnerabilities catalog — fresh zero-days in Cisco ASA/FTD, Ivanti Connect Secure, and Palo Alto products, several of them flagged for ransomware use. One year-long credential-harvesting campaign reportedly exposed more than 70,000 credentials through exposed FortiGate and GlobalProtect appliances. The uncomfortable pattern: a single unpatched box on the edge of your network is a way in, and the box that forwards your logs is squarely in that blast radius.
Every box in that list is recurring headcount and recurring risk — and the internet-facing ones are now a leading entry point for ransomware and credential theft. The collector doesn't differentiate your business, but it shows up in your incident reviews, your audit findings, and increasingly your breach exposure. The question this architecture asks is simple: what if that entire category of toil, and the attack surface that comes with it, just wasn't yours anymore?
The shape of the solution
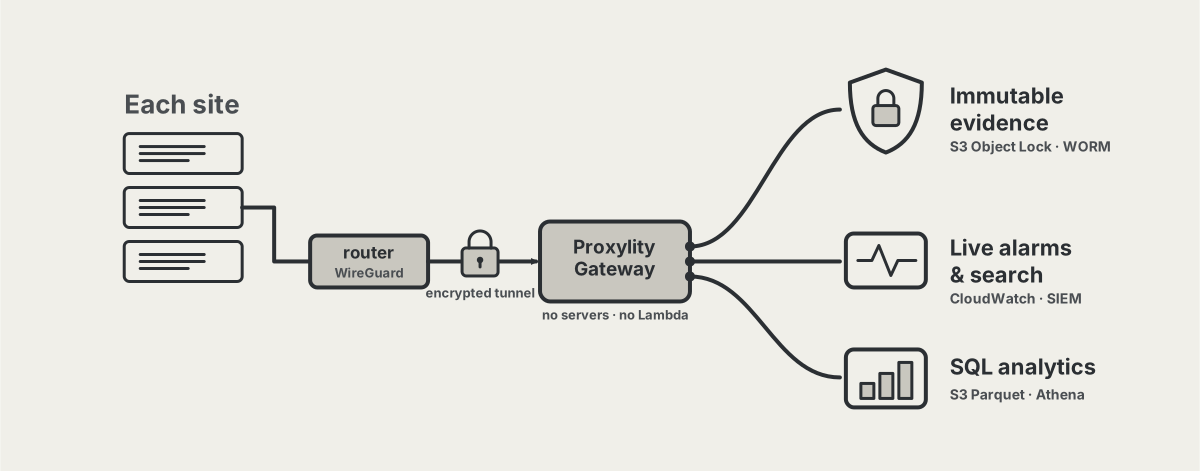
Each site's router opens a WireGuard tunnel to a Proxylity listener. Devices behind the router send ordinary UDP/514 syslog into the tunnel. Proxylity receives it at the edge and fans every message out to three destinations in your own AWS account. That's the whole data plane — and none of it is a server you run.
One WireGuard tunnel per site to a Proxylity listener; the listener fans every datagram out to three destinations in your account. The only thing you operate is configuration.
Each destination has a distinct job, chosen so that the three together cover evidence, operations, and analysis without overlap:
| Destination | Formatter | Lands in | Its job |
|---|---|---|---|
| archive | base64 |
S3 Object Lock bucket (gzip NDJSON) | The original bytes, unchanged, as WORM evidence |
| logs | syslog |
CloudWatch Logs (one JSON event per message) | Metrics, alarms, Logs Insights, SIEM forwarding |
| analytics | syslog |
S3 as Parquet, queried by Athena | SQL over the full retention period |
The entire thing is described by two config files. One is settings; the other is the list of sites. That second file is the single source of truth: each entry simultaneously becomes a WireGuard peer on the listener, a dedicated silence alarm, and a series on the dashboard.
// syslog.peers.json — the list of sites
{
  "Peers": [
    { "Name": "hq-datacenter",  "PublicKey": "tObA...9pXk=" },
    { "Name": "branch-seattle", "PublicKey": "Lm4Z...2vQp=" }
  ]
}
Adding a site is: generate a key pair, add one object to that array, run cdk deploy. The
peer, its alarm, and its dashboard series all follow from the single entry. There is no step where you
also go provision a bigger collector.
Fan-out: one packet, three jobs
The fan-out is where UDP Gateway earns its keep. In a conventional design, getting one syslog message into three different shapes — raw bytes for evidence, structured JSON for alarms, columnar Parquet for SQL — means code: a collector that writes to disk, a parser, a shipper, a transform job. Each is a place to run software and a place for software to break.
Proxylity does the fan-out and the parsing at the edge. A destination is a delivery
target plus a formatter that shapes the bytes on the way out. The base64
formatter preserves the datagram exactly, which is what makes the archive admissible as evidence. The
syslog formatter parses RFC 5424 and RFC 3164 into structured fields, so the logs and
analytics destinations receive clean JSON with no parser of yours in the path.
Because parsing and formatting happen in the gateway, the thing that would normally be your code — the parser, the fan-out, the shippers — is a property of the destination instead. You configure behavior; you don't deploy and patch it.
Each destination also carries its own metrics and its own error channel, so when a device starts sending non-syslog garbage you see it as a parse-failure count and a destination-error, not as a silent corruption three hops downstream. The archive still gets the raw bytes regardless, so you never lose the evidence just because parsing failed.
Identity you can trust
Centralized logs are most useful if you can trust who sent what. Here identity is layered, and the
architecture is clear about how much each layer is worth. Every record arrives wrapped in an envelope
around the parsed Data:
// The envelope around each parsed message
{
  "Remote": { "PeerKey": "tObA...9pXk=", "IpAddress": "203.0.113.9", "Port": 51820 },
  "Inner":  { "SourceAddress": "192.168.1.20", "SourcePort": 514 },
  "ReceivedAt": "2026-11-04T18:22:05Z",
  "Formatter": "syslog",
  "Data": { "hostname": "edge-fw-01", "app_name": "pf", "severity": 3, "message": "..." }
}
Identity is layered and labeled by trust. The site's key is the anchor; everything inside the tunnel is only as good as the router that forwarded it.
This layering is what lets sites reuse the same private address ranges (every record carries the site's
key, so 192.168.1.20 at HQ is never confused with the same address at a branch), and it's
what powers the "hostname inconsistency" analytics query that finds devices whose self-reported name
changes over time. The clarity about trust levels is itself an enterprise feature: an auditor can see
exactly which claims are cryptographic and which are hearsay.
Why "no code" is the point
It's tempting to read "no servers" as a deployment convenience. It's more than that. The absence of code is the thing that collapses the operational and security surface at the same time.
Consider what isn't in this system:
- No collector OS. Nothing to patch on a CVE Tuesday, nothing to harden, nothing to lose a disk on.
- No Lambda in the hot path. Many "serverless" pipelines still run a parser or
transform Lambda per message — code you version, test, patch, and watch for cold starts and
timeouts. Here the parsing is the gateway's
syslogformatter and the fan-out is the gateway's destinations. There is no function of yours to break. - No capacity planning. The gateway absorbs bursts; Firehose buffers downstream. A traffic spike is a line on a graph, not a 2am page.
- No scaling runbook. Adding a tenth site or a hundredth is an entry in a JSON file.
The transport is the sharpest example. There's no VPN appliance here, and so there's no VPN appliance to appear in next quarter's exploited-vulnerability catalog. WireGuard is a protocol in the site router's kernel, not an internet-facing box with an admin portal and a patch cadence. The listener endpoint is Proxylity's to defend and keep patched, under our SLA — not another appliance on your perimeter for an attacker to find.
Every component you don't run is a component that can't be breached, can't drift out of compliance, and can't show up as an unpatched finding. Given where this year's intrusions are starting — unpatched edge devices — "no code" isn't just less work. It's a smaller attack surface by construction.
The recurring cost of a log pipeline is rarely the compute. It's the people-time and the risk: the on-call rotation, the patch cadence, the audit prep, the "who owns this box" conversation after someone leaves. This design moves that whole column to near zero and replaces it with a reviewable config file in your source control. That's not a cost optimization, it's a category removal.
Enterprise chops
Removing the servers would mean little if the result were a toy. It isn't. The same CDK stack stands up the controls an enterprise log platform is expected to have.
Immutable evidence (WORM)
The archive bucket uses S3 Object Lock with a default retention you set, in either
GOVERNANCE or COMPLIANCE mode. In COMPLIANCE mode, retention can't be
shortened or removed by anyone — including the account root. The bucket policy additionally denies
the governance-bypass and lock-configuration actions to everyone except a single named principal
(nobody, by default), so even a future CloudFormation deploy can't quietly weaken the lock. The original
bytes land here before any parsing, so the evidence is the datagram as it arrived.
This matters more than it used to. A recurring move in modern intrusions is to go after the logs themselves — deleting the trail, or quietly narrowing what gets collected so the break-in never appears. The 2026 compliance conversation has followed: SOC 2 Type II reviewers increasingly expect logs held in tamper-evident archives across the whole observation period, not just retained somewhere writable. A WORM archive in COMPLIANCE mode is a direct answer: once written, the evidence can't be edited or deleted by an attacker who reaches your account, by an insider, or by us. That's the difference between "we retain our logs" and "our logs can prove what happened."
Encryption, everywhere, with one key
WireGuard encrypts every site's traffic in transit. One customer-managed KMS key, with rotation, encrypts every bucket and every log group at rest, and TLS is required on every bucket. The key policy is scoped tightly — CloudWatch Logs may use it only for this stack's log groups; S3 and Firehose use is pinned to this stack's resources by source account and ARN — and the key is retained on stack deletion, because the retained archive still needs it.
Separation of duties
Two managed policies ship with the stack, and they're designed to be mutually exclusive on the sensitive bit — the log content:
| Role | Can | Explicitly cannot |
|---|---|---|
| SyslogAuditor | Run Athena queries, read the archive and analytics data, decrypt with the key, run Logs Insights | Delete objects, change retention, lifecycle, or policies |
| SyslogOperator | View dashboards, metrics, alarms, Contributor Insights; toggle alarm actions | Read any syslog content — S3 objects, log events, Athena results, KMS decrypt |
An operator can keep the pipeline healthy without ever reading a customer's logs. An auditor can read and query the evidence without being able to alter or delete it. That's the separation reviewers look for, expressed as IAM rather than as a promise.
Operational visibility built in
The stack creates alarms for high-severity messages, per-site silence (one alarm per site, from that single peer entry), tunnel-down, parse failures, delivery freshness, and destination errors — all to one SNS topic. A dashboard graphs volume, severity, per-site counts, listener health, and Firehose delivery. Three Contributor Insights rules rank the busiest sites, devices, and host/app pairs. A reading matrix in the docs even tells an on-call engineer how to interpret combinations of alarms (one site silent vs. all sites silent vs. tunnel down).
Analytics without a pipeline
The analytics data is Parquet with Glue partition projection — no crawlers, no partition loads — and a set of saved Athena queries ship with the workgroup: high severity in the last day, top sites and devices, volume by hour and severity, parse failures by device, and an archive-vs-analytics cross-check that proves the two paths agree. There's a thin table over the raw archive too, so you can decode and read the original bytes in SQL when you need to scope exactly which objects are evidence for an incident.
Disaster recovery and compliance mapping
Optional cross-region replication copies new archive objects into an Object Lock bucket in another region, retaining each object's lock settings. And the docs map the architecture to the controls assessors actually cite — PCI DSS v4.0 log retention and access controls, NIST SP 800-92, ISO/IEC 27001 A.8.15, SOC 2 CC7.2/CC7.3 — with an honest caveat that an assessor looks at your whole environment, not just this stack.
Where your SIEM fits
If you're an enterprise, you almost certainly already own a SIEM — Splunk, Elastic, Datadog, Sumo Logic. The right question isn't "does this replace it?" It's "how does this complement it?" The answer the architecture gives is a good one: your SIEM becomes one more destination, and it only has to see what's worth correlating.
Setting a single config value (Siem.HecEndpoint) adds a subscription filter on the logs
group that sends events through a Firehose stream to Splunk's HEC endpoint. Firehose unpacks the
CloudWatch Logs batches and delivers one event per syslog message, already structured as JSON —
site, device, parsed fields and all. The same construct swaps cleanly to an HTTP-endpoint delivery for
Elastic, Datadog, or Sumo Logic.
# Splunk props.conf — fields extracted at search time
[proxylity:syslog]
KV_MODE = json
TIME_PREFIX = "ReceivedAt":"
TIME_FORMAT = %Y-%m-%dT%H:%M:%S
TZ = UTC
The subscription filter can carry a pattern, so you choose what reaches the SIEM. That's the economically important part. SIEM ingest is priced like a scarce resource, because it is one. With this design you can forward only severity-4-and-worse to the SIEM for correlation and alerting, while everything — every info and debug line — still lands in the cheap WORM archive and the Parquet analytics store for the full retention period.
This architecture doesn't compete with your SIEM — it feeds it, selectively, and takes the expensive long-tail retention off its plate. Keep the SIEM for correlation and the security team's workflow; let this own immutable evidence, cheap full-fidelity retention, and ad-hoc investigation.
The economics
Three destinations per message is deliberate — and it's the dominant cost driver, because Proxylity charges per delivery and each message is delivered to all three. The baseline below is for sizing, not quoting (assumes ~250-byte messages, every message to all three destinations, 30-day CloudWatch and 365-day S3 retention):
| Item | 1 GB/day | 10 GB/day | 100 GB/day |
|---|---|---|---|
| Messages / month | 120 M | 1.2 B | 12 B |
| Deliveries / month (3×) | 360 M | 3.6 B | 36 B |
| Proxylity — cheapest plan (see below) | ~$375 | ~$1,600 | ~$7,430 |
| CloudWatch Logs ingestion | ~$60 | ~$600 | ~$6,000 |
| Contributor Insights (3 rules) | ~$9 | ~$74 | ~$720 |
| Firehose (both streams + Parquet) | ~$8 | ~$83 | ~$830 |
| S3 (archive + Parquet, Standard + Glacier IR) | ~$2 | ~$21 | ~$210 |
| Athena (~0.1 TB scanned per GB/day) | ~$1 | ~$5 | ~$50 |
| Fixed (metrics, alarms, dashboard, KMS) | ~$20 | ~$20 | ~$20 |
Sizing estimates computed from published Proxylity rates, the Enterprise plan, and AWS list prices at the time of writing. The Proxylity row uses the cheapest of the three plans at each volume (derived in the next section). Proxylity's first listener and first million packets each month are free. Verify against current pricing; these are for sizing, not quotes.
What's striking here isn't just the absolute numbers — it's what's missing from the table. There's no EC2 line. No NAT gateway line. No VPN concentrator line. No line for the engineer-hours to run any of it. The costs are all consumption, variable with your actual traffic.
Choosing the cheapest Proxylity plan — and the batching catch
Proxylity has three ways to pay, and the cheapest one changes with your volume. Getting this right is worth real money, so it's worth understanding the mechanism rather than guessing.
| Plan | How it prices | Cheapest when |
|---|---|---|
| Pay-as-you-go | Progressive per-million-packet tiers ($1.25 down to $0.60/M); no commitment, first 1M free | Pilots and variable or low volume |
| Prepaid credits | Buy into lower tiers up front — about 10% under PAYG for steady volume | Steady volume below the Enterprise breakeven |
| Enterprise | $850/mo flat + per-million-batch tiers ($2.50 down to $1.75/M batches), no per-listener charge, 99.99% SLA, multi-account | Sustained throughput above ~400 packets/sec |
Proxylity batches datagrams before delivery, so destinations receive fewer, larger requests — up to 90% fewer AWS API calls. Under pay-as-you-go and prepaid, that lowers your AWS bill (fewer Firehose and CloudWatch requests) but not your Proxylity bill, which counts individual packets however they're batched. The Enterprise plan prices on batches instead: a batch of 10 packets delivered together is one billable batch. That's the lever — at a batch size of 10, you're billing roughly a tenth as many units, and the batch tiers (even starting at $2.50/M) come out far below per-packet pricing at volume.
Put concretely, here's what the Proxylity bill looks like under each plan at our three volumes, and which one wins:
| Plan (Proxylity only) | 1 GB/day 360M deliveries |
10 GB/day 3.6B deliveries |
100 GB/day 36B deliveries |
|---|---|---|---|
| Pay-as-you-go | ~$415 | ~$3,710 | ~$32,400 |
| Prepaid (~10% less) | ~$375 | ~$3,340 | ~$29,160 |
| Enterprise (batch size 10, incl. $850) | ~$934 | ~$1,600 | ~$7,430 |
| Cheapest | Prepaid | Enterprise | Enterprise |
The crossover is exactly where Proxylity says it is: below roughly 400 packets/sec the $850 subscription isn't worth it, so prepaid wins at 1 GB/day. Above it, batch-based pricing takes over decisively — at 10 GB/day Enterprise is under half the PAYG cost, and at 100 GB/day it's under a quarter (~$7,430 against ~$32,400). Larger batches push it lower still, since batch size is configurable per destination. Proxylity's own worked example lands in the same place: a sustained 1,000 packets/sec runs about $2,709 PAYG versus about $1,396 on Enterprise with batch size 10.
So the guidance is for a progression, not a single answer: start on pay-as-you-go (the free tier likely covers your pilot), move to prepaid once volume is steady for an easy ~10%, and switch to Enterprise once you're sustained above ~400 packets/sec — because at that point batch-based pricing changes the dominant line item, not a rounding error. Existing deployments migrate to Enterprise with listeners and destinations carried over.
The cost lever you control
Regardless of pricing model, you're not stuck paying three deliveries for traffic you don't care about. A BREX filter expression on the logs destination drops low-value messages before they're charged or ingested — and because it's on the logs destination only, the archive and analytics destinations still receive everything. Filtered packets aren't billed by Proxylity (blocked and filtered traffic is never charged) and never reach CloudWatch, which is the two most expensive AWS rows.
This expression keeps severity 4 (warning) or worse and drops notice/info/debug, reading the PRI directly off the datagram:
# Ingest.LogsFilterExpression — keep warning-or-worse, don't pay for chatter
(u8[0] ?? 0) == 60 &&
(
  (
    (u8[2] ?? 0) == 62
      ? (u8[1] ?? 0)
      : (u8[3] ?? 0) == 62
        ? ((u8[1] ?? 0) << 1) + (u8[2] ?? 0)
        : ((u8[1] ?? 0) << 2) + ((u8[2] ?? 0) << 1) + (u8[3] ?? 0)
  ) & 7
) <= 4
Combine the BREX filter (trims the CloudWatch/live path) with selective SIEM forwarding (sends only what's worth correlating) and full-fidelity archive/analytics (cheap S3 keeps everything), and you get a tiered-cost model that most hand-built pipelines never bother to implement: expensive processing only for the messages that warrant it, cheap durable retention for the rest.
You get all three of the things that usually trade off against each other: ease of operation (no servers, no code, no patching), enterprise functionality (WORM, DR, separation of duties, SIEM, analytics), and controllable economics (pure consumption, a cheapest-plan that follows your volume, and explicit levers to tier cost by message value). Pick-two is the usual rule here. This is the rare case where you don't have to.
The bottom line
Centralized syslog has been a solved problem for decades, but "solved" has always come with a standing bill: servers to run, code to patch, capacity to plan, and an audit story to defend. This example pays none of that. The data plane is a WireGuard tunnel into a Proxylity listener that fans each message out to immutable evidence, live operations, and SQL analytics — with your SIEM as an optional fourth consumer that sees only what matters. The control plane is two JSON files and a CDK stack in your source control.
It runs no servers. It runs no Lambda. There is nothing to patch, and nothing of yours on the perimeter for this year's edge-device campaigns to find. And it still does more than most collectors you've operated — with economics you can actually tune. If you own the budget or the audit for your logging platform, we think that combination is worth an afternoon of your architects' time.
We built the complete example in the open — CDK source, config, site-router recipes for Linux, OpenWrt and rsyslog, saved Athena queries, and the compliance mapping — in the Proxylity syslog repository. Clone it, point a site at it, and send a test message. And if the numbers in the economics section look relevant to your volume, talk to us — we'll model it against your real traffic.